
Listed provider records
651
Current directory dataset
Compare 651 RestoreRadar listings across 20 U.S. metros in this 2026 dataset. Download the figures with source notes and limits. It is not a national census.
This report aggregates 651 RestoreRadar-listed restoration provider records across 20 metros in Texas, Florida, Louisiana, Illinois, South Carolina, CA, NY, and MA. It measures what RestoreRadar can source consistently across the published directory: provider-stated 24/7 response and direct insurance billing, public Google rating and review volume, domain-matched Google Business locations, IICRC Certified Firm matches, and official state mold-credential matches.
Within this directory dataset: 86.6% of listed records state 24/7 response, 53.0% state direct insurance billing, 77.6% have a matched public Google rating, and 24.6% match an IICRC Certified Firm record. These are proportions of RestoreRadar’s published records, not national industry rates.
Download the figures to compare the companies listed in each area. The totals come from the same listings shown in our directories and company profiles. The report does not contain provider contact details or personal information.
Current directory dataset
Texas, Florida, Louisiana, Illinois, South Carolina, CA, NY, and MA
81.3% of listed records
77.6% of listed records
Across matched rated listings
24.6% of listed records
9.4% of listed records
86.6% of listed records
This snapshot describes our current listings. Without a comparable earlier snapshot, it cannot show industry growth, decline, or trends.
Emergency-response language is more prevalent than direct-billing language. 86.6% of listed records state 24/7 response, while 53.0% state direct insurance billing—a 33.6 percentage-point gap. Both are provider website statements, not tests of availability, response speed, or claims handling.
Public business identity is easier to corroborate than specialized credentials. 81.3% of listed records have a domain-matched Google Business location. The narrower IICRC and state mold-credential matches use different official source scopes; a missing match remains unconfirmed and must not be read as evidence that a provider is unqualified or unlicensed.
This chart compares the share of listed records whose provider website states 24/7 response or direct insurance billing. It uses the same metro rows as the downloadable data and is provided as an SVG for legible reuse.
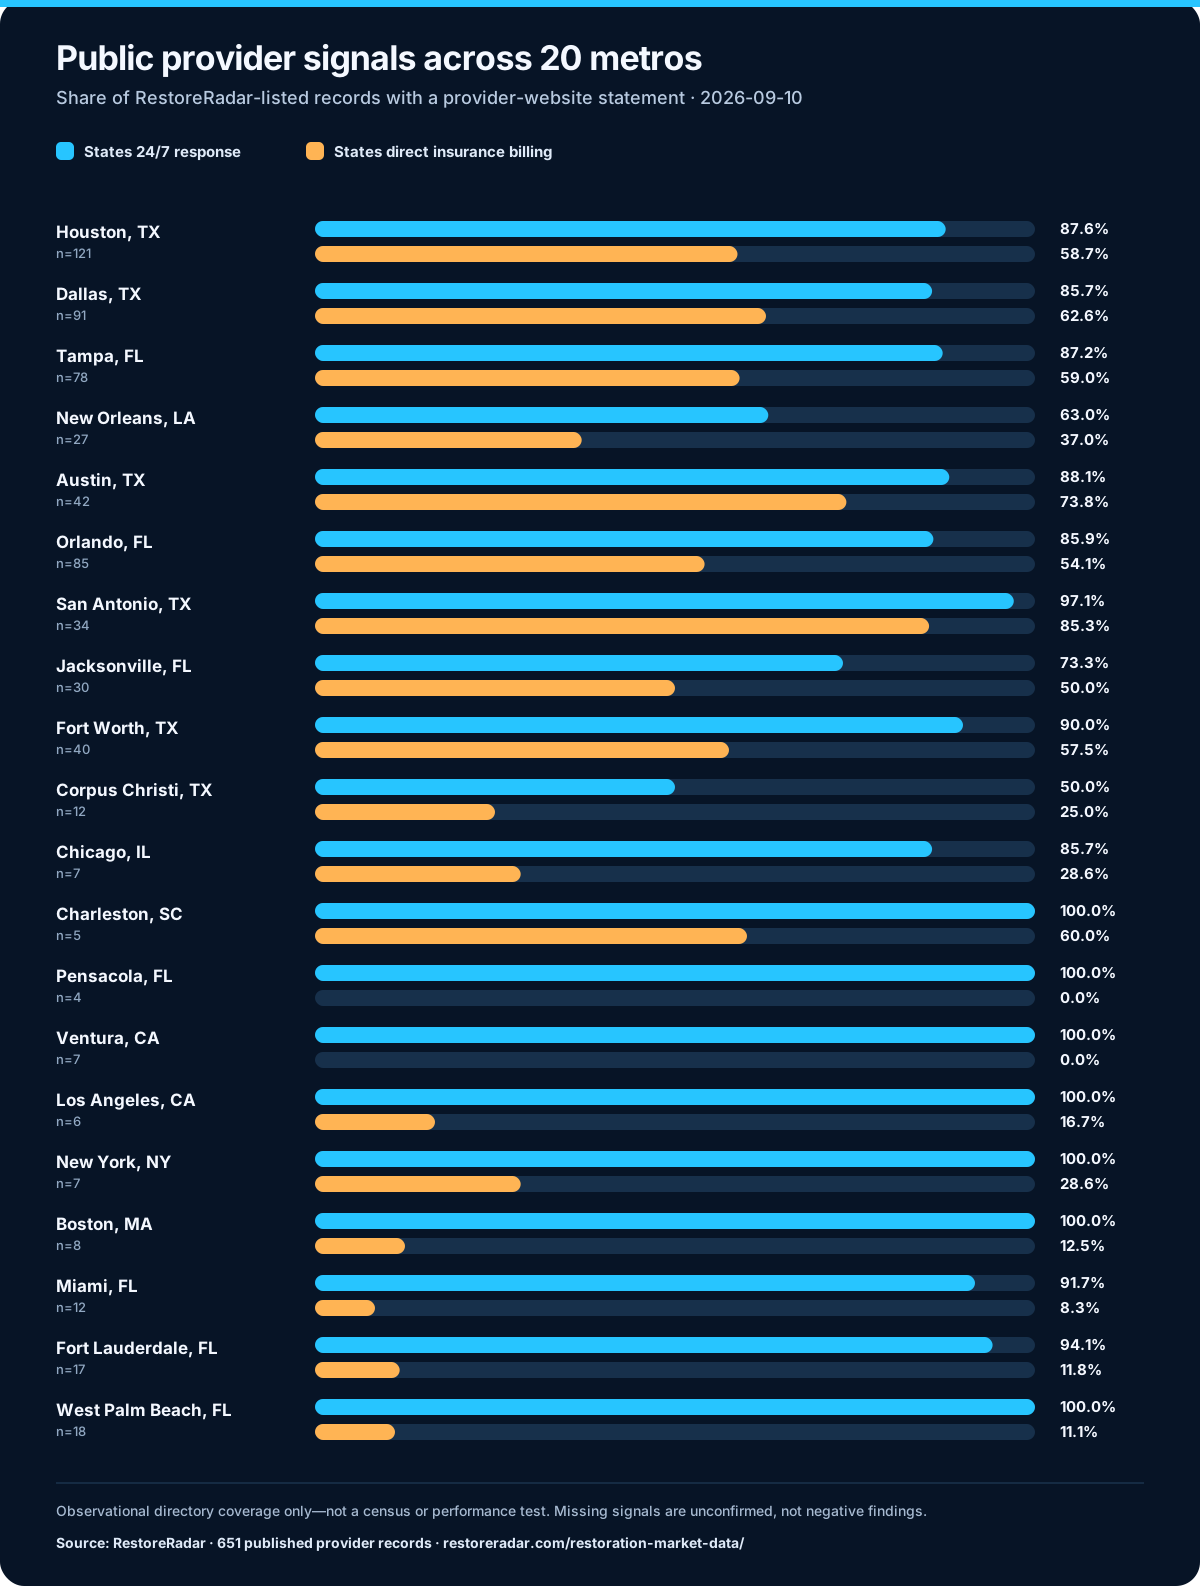
Publishers may embed the current SVG without resizing a screenshot. Keep the visible “not a census or market-share measure” note and the branded source attribution so readers can inspect the methodology. The source link is deliberately nofollow; RestoreRadar does not require or trade ranking credit for reuse.
<figure>
  <img src="https://restoreradar.com/data/restoration-provider-signals-by-metro.svg" width="1200" height="1586" alt="Grouped horizontal bar chart comparing provider-stated 24/7 response and direct insurance-billing shares across 20 covered metros." />
  <figcaption>RestoreRadar-listed records; not a census or market-share measure. Source: <a href="https://restoreradar.com/restoration-market-data/#methodology" rel="nofollow">RestoreRadar market data</a>.</figcaption>
</figure>
The chart summarizes RestoreRadar’s published directory records as of 2026-09-10. It does not measure total local supply, market share, current availability, response speed, job quality, or claims performance. You may also download the SVG directly.
The table compares the current directory footprint metro by metro. “24/7” and “insurance direct” are statements observed on provider websites. Ratings and review totals are public Google Business data attached only when the business identity can be matched. Credential counts require a named match in the relevant official registry.
| Metro | Listed | 24/7 | Insurance direct | Rated | Reviews | Matched locations | IICRC firms | State mold credentials |
|---|---|---|---|---|---|---|---|---|
| Houston, TX | 121 | 106 | 71 | 115 | 12,817 | 116 | 35 | 19 |
| Dallas, TX | 91 | 78 | 57 | 87 | 7,335 | 89 | 30 | 14 |
| Tampa, FL | 78 | 68 | 46 | 73 | 8,858 | 75 | 25 | 1 |
| New Orleans, LA | 27 | 17 | 10 | 21 | 1,463 | 23 | 4 | 7 |
| Austin, TX | 42 | 37 | 31 | 38 | 2,518 | 40 | 14 | 7 |
| Orlando, FL | 85 | 73 | 46 | 70 | 6,242 | 77 | 17 | 0 |
| San Antonio, TX | 34 | 33 | 29 | 31 | 2,525 | 33 | 10 | 6 |
| Jacksonville, FL | 30 | 22 | 15 | 26 | 2,233 | 24 | 7 | 0 |
| Fort Worth, TX | 40 | 36 | 23 | 36 | 3,767 | 38 | 12 | 7 |
| Corpus Christi, TX | 12 | 6 | 3 | 8 | 457 | 9 | 0 | 0 |
| Chicago, IL | 7 | 6 | 2 | 0 | 0 | 5 | 6 | 0 |
| Charleston, SC | 5 | 5 | 3 | 0 | 0 | 0 | 0 | 0 |
| Pensacola, FL | 4 | 4 | 0 | 0 | 0 | 0 | 0 | 0 |
| Ventura, CA | 7 | 7 | 0 | 0 | 0 | 0 | 0 | 0 |
| Los Angeles, CA | 6 | 6 | 1 | 0 | 0 | 0 | 0 | 0 |
| New York, NY | 7 | 7 | 2 | 0 | 0 | 0 | 0 | 0 |
| Boston, MA | 8 | 8 | 1 | 0 | 0 | 0 | 0 | 0 |
| Miami, FL | 12 | 11 | 1 | 0 | 0 | 0 | 0 | 0 |
| Fort Lauderdale, FL | 17 | 16 | 2 | 0 | 0 | 0 | 0 | 0 |
| West Palm Beach, FL | 18 | 18 | 2 | 0 | 0 | 0 | 0 | 0 |
A provider can appear in more than one service row, so these rows overlap and should not be added together. They show the depth and geographic reach of each service category inside the current directory, not the total size of the U.S. restoration industry.
| Service | Listed | Metros | 24/7 | Insurance direct | Rated | Reviews |
|---|---|---|---|---|---|---|
| Water Damage Restoration | 588 | 20 | 526 | 325 | 449 | 40,133 |
| Fire & Smoke Damage Restoration | 349 | 11 | 318 | 227 | 313 | 31,561 |
| Mold Removal & Remediation | 413 | 11 | 359 | 233 | 365 | 36,390 |
| Storm Damage Restoration | 176 | 11 | 166 | 125 | 156 | 15,498 |
Compare company counts and reported services for each type of damage in each metro. The 80 rows summarize our local directories; the download does not identify individual companies.
Download the metro-by-service CSV. Providers can appear in more than one service row. Counts describe RestoreRadar’s published directory footprint—not total local supply, current availability, market share, or service quality.
Choose a city and damage type to compare companies. These 80 local directories include the listings counted above, with company details, sources, and questions to ask before hiring.
RestoreRadar currently classifies 588 published provider records under water damage restoration across 20 covered metros. Within that service row, 526 (89.5%) state 24/7 response, 325 (55.3%) state direct insurance billing, and 449 (76.4%) have a matched public Google rating.
149 water-service records (25.3%) match an IICRC Certified Firm entry. Missing matches are unconfirmed, not negative findings. Providers can appear in more than one service row, and these figures describe RestoreRadar’s current directory classification—not the total number, market share, revenue, or performance of water-damage companies.
Browse water damage restoration companies by cityProvider websites. RestoreRadar records service coverage, 24/7 response, and direct insurance-billing statements when they are visible on a provider’s own website. These are attributed provider statements, not independent tests of response time, availability, coverage, or claims handling.
Google Business data. Public rating, review-count, and location signals are included only when the Google Business identity is matched to the provider’s website domain or another approved identity key. The review total is the sum of the public review counts represented by those matched listings; RestoreRadar does not reproduce individual reviews in this dataset.
Official credentials. IICRC Certified Firm status is matched against the IICRC Global Locator. State mold credentials are matched against the official Texas TDLR, Florida DBPR, or Louisiana LSLBC roster. The narrower claim and its limitations appear on each eligible provider receipt.
Freshness and corrections. The aggregate inherits the committed provider, city, and service provenance date shown below. Provider facts change, registries change, and companies enter or leave markets. To report an error, use the contact page. For the evidence classifications and dispute rules, read Verification Standard v1.0.
The JSON download carries these definitions, source classes, limitation notes, citation text, and canonical methodology links alongside the data. Counts are non-negative integers; a missing confirmation must not be interpreted as a negative finding.
| Field | Type | Objects | Definition |
|---|---|---|---|
metro_slug |
string | metros, metro_services | Canonical RestoreRadar path slug for the covered metro. |
city |
string | metros, metro_services | Primary city name used for the RestoreRadar metro. |
state |
string | metros, metro_services | Two-letter U.S. state abbreviation. |
service_slug |
string | services, metro_services | Canonical RestoreRadar path slug for the restoration service. |
service |
string | services, metro_services | Reader-facing restoration service name. |
metros_represented |
integer | services | Covered metros containing at least one listed provider record classified for the service. |
listed_providers |
integer | totals, metros, services, metro_services | Published RestoreRadar provider records in the stated slice; not a census of all operating companies. |
provider_stated_24_7 |
integer | totals, metros, services, metro_services | Listed records whose provider website states 24/7 response; not an independent availability or response-time test. |
provider_stated_insurance_direct_billing |
integer | totals, metros, services, metro_services | Listed records whose provider website states direct insurance billing; not an independent claims-handling test. |
google_rated_listings |
integer | totals, metros, services, metro_services | Listed records with a public Google rating attached to a matched business identity. |
google_review_total |
integer | totals, metros, services, metro_services | Sum of public Google review counts represented by the matched rated listings; individual reviews are not included. |
domain_matched_google_business_locations |
integer | totals, metros, services, metro_services | Listed records with a Google Business location matched by website domain or another approved identity key. |
iicrc_certified_firms |
integer | totals, metros, services, metro_services | Listed records matched to a current IICRC Certified Firm entry under RestoreRadar verification rules. |
official_state_mold_credentials |
integer | totals, metros, services, metro_services | Listed records with an eligible mold credential matched in an official Texas, Florida, or Louisiana state source; the credential scope differs by state. |
Download the metro data as CSV, download the metro-by-service data as CSV, download the full aggregate report as JSON, or download the metro signal chart as SVG. The JSON includes totals, metro rows, service rows, metro-service rows, and the limitation notes in one machine-readable file.
Suggested citation: RestoreRadar, “Restoration Industry Statistics from 651 Provider Records,” updated 2026-09-10, https://restoreradar.com/restoration-market-data/. Include the date you accessed the file and keep the “not a census” limitation with any comparison derived from it. If you publish an analysis using the data, email hello@restoreradar.com; corrections and useful follow-up questions help improve the next release.
Archived citation package. The public versioned July 30 GitHub release preserves that dated snapshot with its CITATION.cff, SHA-256 checksums, and release assets. Use the current downloads above for RestoreRadar’s latest published aggregate. The archive is a self-published reproducibility aid—not independent validation, an earned citation, or evidence that anyone reused the data.
Reuse terms. RestoreRadar grants permission to use, analyze, quote, and redistribute these aggregate files, including modified extracts, with attribution to RestoreRadar and a link to the report. This permission covers RestoreRadar’s aggregation and presentation only; it does not grant rights in underlying third-party source data, provider names, logos, or trademarks. Preserve the published limitations when reporting comparisons.
Update schedule. Recomputed with each published RestoreRadar data refresh; no fixed calendar schedule.
Directory maintained by RestoreRadar · Dataset updated · Details come from company websites and public Google Business records. Unconfirmed fields are left blank.